Climate+
Our pathway to a Net Zero value chain by 2050
78
%
reduction in Scope 1 and 2 greenhouse gas emissions from 2020 to 2024
9
%
reduction of overall emissions (scope 1, 2, 3) per liters of food packed from 2020
100
%
renewable electricity for production in 2024
We are supporting global goals by driving greenhouse gas (GHG) emission reductions in our operations and throughout our value chain in line with the latest standards of the Science Based Targets initiative (SBTi).
Our products play a key role by offering customers the lowest carbon packaging solutions in each relevant market segment. Aseptic cartons, bag-in-box and spouted pouches also help reduce carbon emissions by preserving food for long periods without the need for refrigerated delivery or storage.
Climate change poses a significant threat to both human health and the planet. Extreme weather events not only affect health – they can restrict access to resources, thereby endangering livelihoods. There is a rapidly closing window of opportunity to secure a regenerative and inclusive future for all.
Risks to natural and human systems are expected to be lower with global warming at 1.5°C.1 However, to limit warming to 1.5°C, the world needs to reach Net Zero – the point at which a balance is achieved between emissions produced and emissions removed from the atmosphere – by 2050.1 Tackling climate change is also closely tied to efforts to halt biodiversity loss and support nature positive outcomes. By combining innovation with responsible environmental management, we can drive economic growth while protecting ecosystems and conserving natural resources for future generations.
On top of our efforts to reduce our footprint, we are working to achieve positive outcomes on climate change mitigation and adaptation within and beyond our value chain. All our actions help us to mitigate climate-related risks for our business and strategy, which we regularly assess, while meeting growing expectations from stakeholders for corporate action on climate.
Our commitments
We are supporting the transition to a lower-carbon economy by reducing the environmental impact of our company, our sourcing and our products. We are committed to continue offering our customers the lowest carbon packaging solutions in every market segment and are pioneering even lower-carbon packs.
Our pathway to Net Zero prioritizes decarbonization of our operations and value chain in line with climate science to help keep global warming below 1.5°C. This requires a transition to a lower-carbon economy in which companies reduce their environmental impact and – more radically – decouple emissions and production growth.
Our SBTi-approved targets set clear and ambitious goals for reducing greenhouse gas emissions.
Near-term commitments for 2030:
- 42% absolute reduction of Scope 1 and 2 greenhouse gas emissions (from 2020)
- 100% renewable electricity through 2030
- 51.6% reduction of Scope 3 greenhouse gas emissions per liter packed (from 2020)
Long-term targets for 2050:
- 90% absolute reduction of Scope 1 and 2 greenhouse gas emissions (from 2020)
- 97% reduction of Scope 3 greenhouse gas emissions per liter packed (from 2020)
- Net Zero value chain greenhouse gas emissions
Our targets and climate transition plan are comparable with Swiss climate goals. See our TCFD report, the KPI section below and the appendix on Greenhouse gas emissions basis for reporting.
Reducing carbon footprint at every stage of the life cycle
Our commitment to the lowest carbon packaging solutions is based on ISO-compliant, critically reviewed and science-based life-cycle assessments (ISO 14040 series). The visual below shows how we are working to reduce the carbon footprint of our packs at every stage of their life cycle.
For more on the results of our life-cycle assessments following ISO 14040, see Sustainable innovation.
Aseptic carton1

Bag-in-box1

Spouted pouch1


Design
Environmental considerations are core value drivers in our product development. Our sustainable innovation includes:
- replacing virgin fossil-based polymers with renewable or recycled alternatives
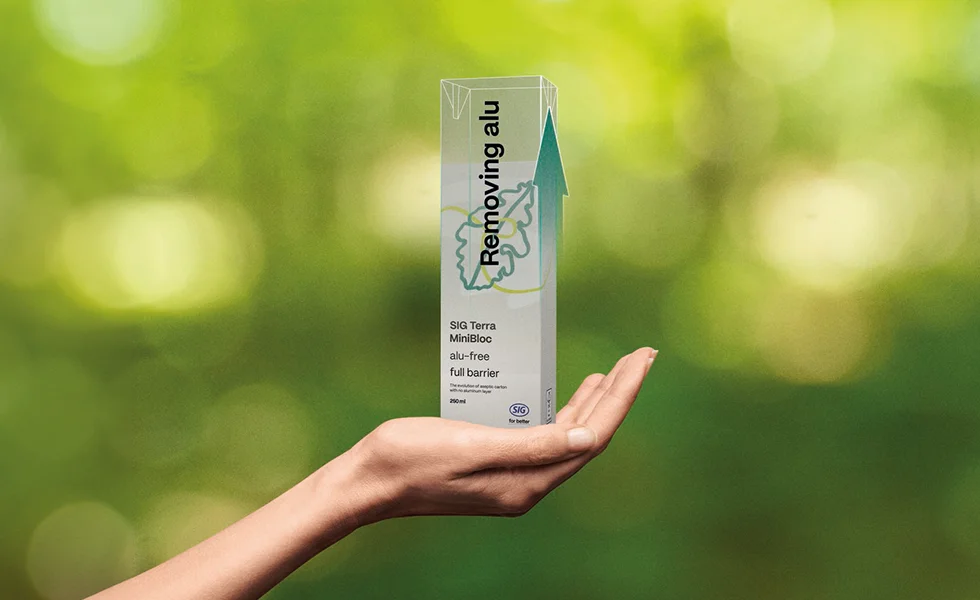
- eliminating the need for carbon-intensive aluminum
- optimizing resource use in packs and filling
- making more of our bag-in-box and spouted pouch solutions recycle-ready.

Sourcing
Our cartons are made mainly from renewable paperboard. We source renewable polymers1 for our SIG Terra solutions and offer recycled polymers4 for aseptic cartons, while piloting these for bag-in-box. We also reduce the carbon footprint of materials by sourcing them with certifications, such as FSC™, which provides carbon benefits from sustainable forestry, and ASI, which requires aluminum smelters to limit and reduce their carbon emissions.
1 Linked to forest-based renewable material and recycled polymers via an independently certified mass balance approach.

Manufacturing
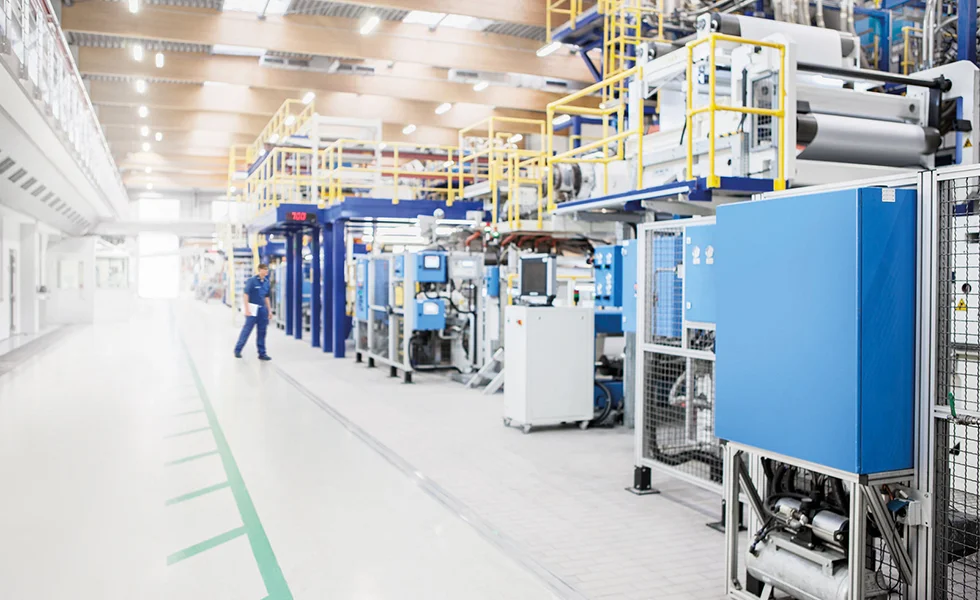
We make our packaging using 100% renewable electricity and, while we explore viable alternatives, we compensate emissions from use of non-renewable energy in production through Gold Standard CO2 offsets. ISO 14001 certified environmental management systems support continuous improvement in energy use and greenhouse gas emissions at all our plants. Training helps employees understand how they can play their part in cutting our environmental impacts, including energy use and greenhouse gas emissions.

Transportation
Our aseptic packs avoid the need for fuel-intensive refrigerated transportation by enabling food to be safely transported and stored in ambient conditions. Our carton packs also help customers cut emissions from distributing their products as they are lighter weight and use space more efficiently than alternative packaging types, such as bottles and cans. We further reduce transportation emissions by delivering our packs to customers in compact form and filling trucks fuller for fewer journeys and less fuel use. Our new aseptic carton production plant in Mexico has increased local production capacity to serve the Americas, reducing transportation distances to customers.

Filling
Our aseptic filling technology helps to prevent food waste – a major driver of global CO2 emissions – by ensuring food can be safely stored for up to 12 months. We strive to improve the efficiency of our filling machines with every new generation. SIG NEO, our next-generation filling machine for family-size aseptic cartons, is designed to cut energy use and offer a 25% lower carbon footprint.1 Our technical service teams help aseptic carton customers minimize the use of water, energy and compressed air in their factories, including through upgrade kits for existing machines and the SIG EcoFill Consulting program.
1 Anticipated savings compared with our previous generation filling machines.

Recycling
Our cartons are designed to be fully recyclable and we are working to make more of our bag-in-box and spouted pouch solutions recycle-ready.
We work through industry associations to advocate enabling legislation and we partner with a range of local stakeholders on programs to improve collection and recycling rates of used packaging. These programs cut emissions from landfill and keep materials in circulation.
Our approach
Measures to reduce Greenhouse Gas Emissions from our operations, value chain and beyond
Direct operations
- Implement energy-saving technologies in factories and offices.
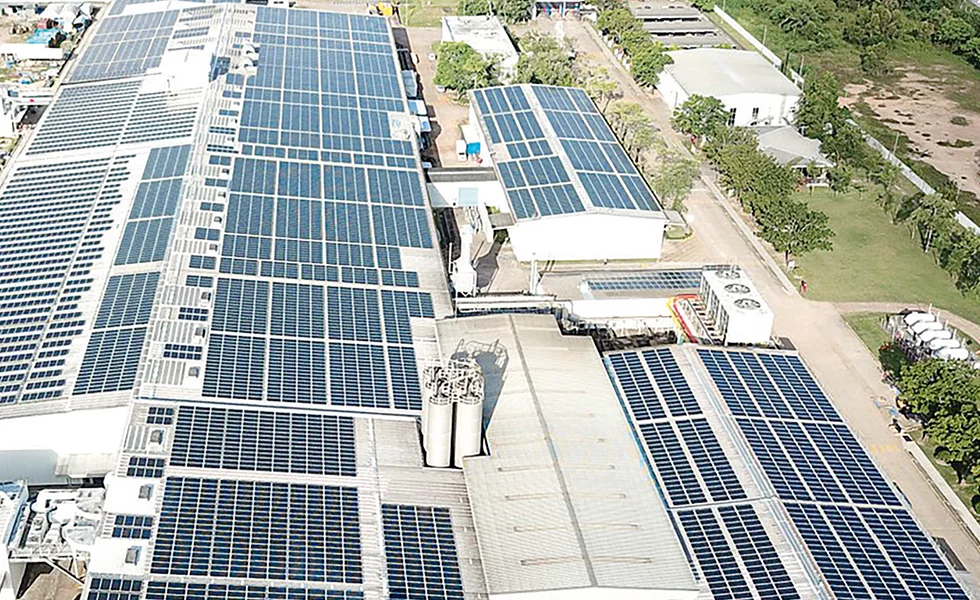
- Direct sourcing of renewable electricity: on-site solar and power purchase agreements.
- Replace natural gas e.g., with biogas, green hydrogen.
- Transition on-site vehicles to electric or renewable energy sources.
- Use biomaterials for printing.
- Explore carbon capture technologies or other low-carbon innovations to reduce emissions from our manufacturing processes.
Upstream value chain
- Collaborate with suppliers to implement low-carbon technologies in their manufacturing processes, focusing on energy efficiency improvements, renewable energy adoption, and sustainable production methods.
- Engage with suppliers to optimize sourcing practices and reduce the footprint of our key materials by improving material efficiency, minimizing waste and selecting more sustainable alternatives if available.
- Transition the product portfolio to aluminum-layer-free packaging solutions, focusing on innovative, low-carbon alternatives that reduce overall emissions without compromising product quality or performance.
- Shift to low-carbon and recycled materials by sourcing sustainable alternatives produced with renewable energy and incorporating recycled content into packaging.
- Optimize inbound logistics to reduce transportation emissions by improving supply chain efficiency, adopting greener transportation methods and partnering with sustainable logistics providers.
- Transition supplier transportation fleets to alternative fuels or electric vehicles.
In 2025, we will intensify our supplier engagement with a program starting with scoping and priority setting to identify key suppliers with the highest potential for impact. Within this program we will provide targeted support to these suppliers through capacity building, tailored resources, and expert guidance to help them adopt sustainability practices aligned with climate science.

Downstream value chain
- Reduce utility and electricity demand for our filling machines and equipment.
- Enhance end-of-life recycling by collaborating with municipalities and waste management systems, increasing the recyclability of packaging, and developing recycling infrastructure in regions with poor recycling systems.
- Create closed-loop recycling systems in partnership with retailers for packaging returns.
- Promote consumer education on proper recycling methods; introduce reusable packaging programs or extended producer responsibility schemes; and provide tools and resources that help customers measure and reduce their carbon footprint related to SIG’s products.
Beyond value chain
- Support land restoration and carbon capture projects to create carbon sinks beyond SIG’s direct value chain.
- Contribute to renewable energy projects outside SIG’s direct operations, such as wind or solar farms in developing countries or regions with limited access to clean energy.
- Partner with NGOs, governments, and industry groups to drive innovation in sustainability and promote climate-positive initiatives beyond SIG’s immediate footprint.
- Participate in public-private partnerships to foster system-wide decarbonization across sectors.
Our targets and performance
Targets, progress and performance
Target |
|
Progress tracker |
|
2024 performance |
|---|---|---|---|---|
Material topic: Climate change |
||||
Net Zero value chain greenhouse gas emissions by 2050 |
|
|
|
Our pathway to Net Zero prioritizes decarbonization of our operations and value chain, and we are implementing a series of workstreams to support progress |
Reduce Scope 1 and 2 greenhouse gas emissions by 42% by 2030 – and by 90% by 2050 (from 2020) |
|
|
|
We have cut our total Scope 1 and 2 greenhouse gas emissions by 78% from the 2020 baseline |
Reduce Scope 3 greenhouse gas emissions by 51.6% per liter packed by 2030 – and by 97% by 2050 (from 2020) |
|
|
|
Our Scope 3 emissions per liter packed decreased by 5% from 2020, slightly behind our reduction pathway |
Maintain 100% renewable electricity and Gold Standard CO2 offset for all non-renewable energy (at production plants) |
|
|
|
We used 100% renewable electricity to make our packs and compensated for all non-renewable energy for production through Gold Standard CO2 offsets |
Expand use of on-site solar power to meet at least 10% of our global electricity use as part of overall renewable power purchase agreements (PPAs) to meet 25% of our global electricity use by 2025 |
|
|
|
We have expanded our total on-site solar capacity to 37.7 MWp. On-site solar power met 6.5% of our global electricity needs for production this year and, overall, renewable PPAs (both on- and off-site) met 22.6% |
Transition to 100% bioethanol or other biomaterials for printing our aseptic cartons by 2025 |
|
|
|
Since January 2024 all of our aseptic plants only purchase plant-based ethanol for printing purposes |
Reduce CO2 emissions from inbound and outbound logistics by 18% (from 2020) by 2025 |
|
|
|
CO2 emissions from our inbound and outbound logistics across SIG Group have decreased by 11% from 2020 |


Measures to decarbonize our value chain in 2024
- We refined our strategies for the main Scope 3 categories, adjusting the impact and timing of critical projects such as the transition to aluminum-free packaging and portfolio changes for packaging and machines, while considering growth forecasts.
- We prioritized strengthening partnerships with key suppliers, particularly for major commodities, to reduce emissions throughout our supply chain via collaboration projects.
- We identified carbon removal solutions within our supply chains, including logistics and commoditysourcing, as part of a holistic approach to emissions reduction.
- To ensure we remain on track to meet our mid- and long-term goals, as well as customer expectations, we have developed interim emission reduction milestones to closely monitor progress and make adjustments as needed.
- We provided Scope 3 greenhouse gas emissions data for our customers across substrates.
- Efforts were intensified to boost collection and recycling rates in key regions through the Resource+ program.
Assessing effectiveness
We assess the resilience of our business strategy in the light of climate-related risks. Our operations report plant specific data, energy usage and emissions on a monthly basis. The GEB conducts monthly reviews of production KPIs. The Vice President of Global Sourcing and Procurement, who reports to the Chief Supply Chain Officer2, conducts a regular review of raw materials and energy sourcing. The Chief Supply Chain Officer reviews Climate+ projects on a quarterly basis3.
Responsibility for managing the Climate+ program
- Raw materials and energy sourcing: Global Sourcing & Procurement
- Production: Global Production & Supply Chain, supported by Global Environment, Health & Safety (EHS)
- Product design: Global Technology with support from Global Marketing
- Filling machines: Global Research & Development and Global Engineering & Application teams
- Logistics: Global Supply Chain Management
- Recycling: Local teams, overseen by Regional Presidents
Progress in 2024
In 2024, we set clear interim milestones toward achieving Net Zero for both our own operations (Scope 1 and 2) and across our entire value chain (Scope 3), based on in-depth analysis of a range of scenarios and working closely with our suppliers to ensure alignment with our sustainability goals. As part of our Climate+ approach, we are also identifying and pursuing opportunities for beyond-value-chain mitigation to further reduce our environmental impact.
SIG Group emissions
by category in 20241


Decarbonizing own operations
- We continued to make progress in reducing Scope 1 and 2 emissions, primarily through the purchase of renewable electricity.4 We have achieved approximately 78% savings since 2020, well ahead of our 2030 target of a 42% reduction.
- Reducing Scope 1 emissions from the combustion of fossil fuels in our operations remains a key challenge. The Operations, EHS, and Sourcing (GSP) teams are actively working to identify and implement solutions to address this issue as part of our broader sustainability efforts.
- Further efforts are needed to achieve our near-term SBTi 2030 target of a 51.6% reduction in Scope 3 GHG emissions per liter packed from 2020 (currently at 5%).
- While we have already reduced overall5 emissions per liter packed by 9% between 2020 and 2024, challenges such as the disproportionate growth of smaller packaging formats and expansion into regions with lower recycling rates are offsetting some of our progress.
- To address these obstacles and accelerate progress, we are increasing the scope of our Climate+ program (see Outlook).
- We maintained ISO 50001 certification for energy management systems at our three aseptic carton production plants in Europe and achieved certification for our bag-in-box/spouted pouch plant in Eisfeld, Germany.
SIG Group emissions rate – Scope 1, 2, and 3 greenhouse gas emissions intensity
(grams CO2e/liters of food packed)

Decarbonizing our value chain
- As of 2024, we have achieved a total emissions intensity of 67 gCO2e per liter packed6, considering all emissions across SIG Group (Scope 1, 2, and 3).
- Sales of SIG Terra solutions increased by a further 9%6 in 2024. These solutions lower the carbon footprint of our aseptic cartons by up to 63%7 and have now avoided an estimated 83,800 metric tons of CO2 equivalent emissions (compared with standard SIG aseptic cartons).8 See Sustainable innovation
- Globally, we have maintained a high full-truckload rate (95%) for delivering our aseptic cartons since 2021. In 2024, the rate was 93.8%, as the challenging global logistics situation led customers to place smaller orders to quickly fill production gaps.
- Future reductions in outbound logistics will depend on the availability of lower-carbon alternatives in the transportation market (trucks, vessels). See our e-truck success story below.
- Through continuous improvements, the energy requirements of our filling machines in the aseptic carton business that were sold in 2024 were reduced by 2% vs the base year 2020. For the bag-in-box, spouted pouch and carton filling equipment businesses, we are defining energy reduction targets and plan to report them from 2025.9
2024 success stories
Transportation and travel
Launch of our first e-truck transportation in Europe
In November 2024, we embarked upon an exciting journey towards more sustainable logistics in Europe. We have worked in close collaboration with our trucking partner, their warehouse, and one of our customers to implement our first fully electric truck (e-truck) operation. This represents a significant step forward in reducing our carbon emissions in the transportation segment.
The e-truck will operate on a dedicated roundtrip route from Linnich to Mechernich and back, potentially including an additional stop at our customer’s location. This carefully planned route ensures the e-truck’s efficiency, aligns with charging needs, and strengthens the partnership between all parties involved.
This project is a testament to our commitment to low-carbon transportation solutions and our ability to bring together stakeholders for a common sustainability goal. By taking this proactive step, we are contributing to a cleaner future while maintaining our promise of reliable and efficient deliveries.
Optimizing business travel for maintenance
One of the key activities of our SIG Performance & Reliability Centers is to help customers quickly and effectively, addressing any problems that may arise. Our System Experts in Curitiba, Brazil, for example, are using different remote service tools to avoid long unplanned downtimes. In 2024 this resulted in ~139 avoided journeys and 28,520 kg of saved CO2e in South America (calculated by ifeu institute). This avoided travel has a positive impact on total cost of ownership for our customers and also improves the sustainability footprint of SIG service operations.
Reducing energy consumption
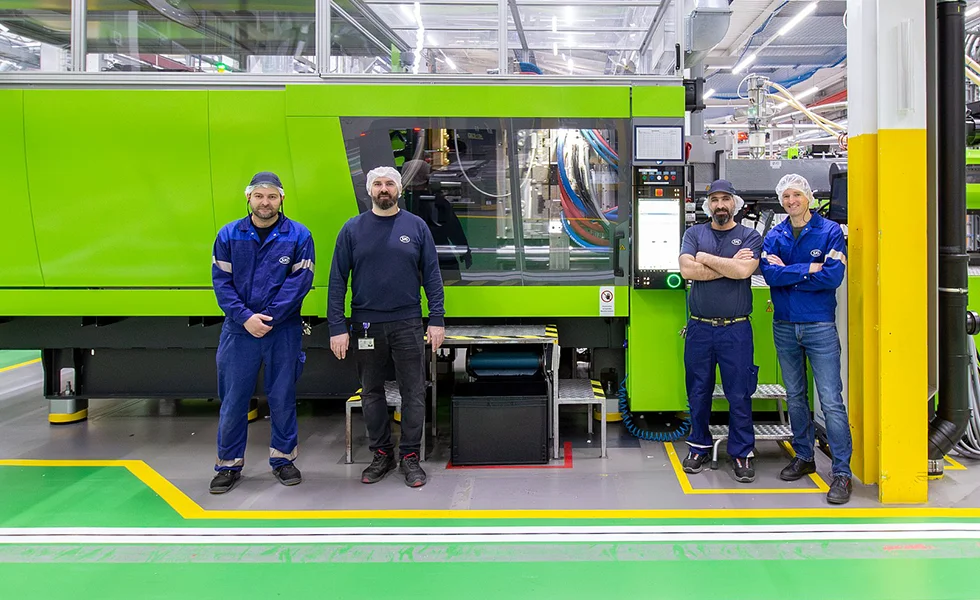
Since July 2024, all our EU customers have been required to use tethered caps in order to reduce littering. Our caps and closures production plant in Neuhausen, Switzerland needed new injection molding machines in order to meet demand. Our main focus in making the switch was energy efficiency.
The old hybrid or hydraulically driven machines – considered energy-efficient just a few years ago – have been replaced by fully electric machines which consume up to 60% less energy.
KPIs
Metric |
|
2020 |
|
2021 |
|
2022 |
|
2023 |
|
2024 |
||||||||||
|---|---|---|---|---|---|---|---|---|---|---|---|---|---|---|---|---|---|---|---|---|
Climate+ |
|
|
|
|
|
|
|
|
|
|
||||||||||
Material topic: Climate change1 |
|
|
|
|
|
|
|
|
|
|
||||||||||
Total Scope 1 and 2 greenhouse gas emissions (thousand metric tons CO2 equivalent) |
|
91.1 |
|
71.1 |
|
72.2 |
|
19.5 |
|
20.1 |
||||||||||
Total Scope 3 greenhouse gas emissions (million metric tons CO2 equivalent) |
|
1.95 |
|
2.01 |
|
2.01 |
|
1.95 |
|
2.02 |
||||||||||
Scope 3 greenhouse gas emissions intensity (grams CO2 equivalent/liter of food packed)2 |
|
70 |
|
68 |
|
67 |
|
66 |
|
66 |
||||||||||
Scope 1, 2, and 3 greenhouse gas emissions intensity (grams CO2 equivalent/liter of food packed)2 |
|
73 |
|
70 |
|
69 |
|
67 |
|
67 |
||||||||||
Scope 1 greenhouse gas emissions for production (thousand metric tons CO2 equivalent) |
|
28.6 |
|
27.4 |
|
24.1 |
|
19.0 |
|
20.1 |
||||||||||
Scope 1 greenhouse gas emissions for aseptic carton production (thousand metric tons CO2 equivalent) |
|
28.3 |
|
27.0 |
|
22.8 |
|
18.6 |
|
18.6 |
||||||||||
Scope 2 greenhouse gas emissions for production (market-based) (thousand metric tons CO2 equivalent) |
|
62.5 |
|
43.7 |
|
48.1 |
|
0.5 |
|
0 |
||||||||||
Scope 2 greenhouse gas emissions for aseptic carton production (market-based) (thousand metric tons CO2 equivalent) |
|
22.9 |
|
0 |
|
0 |
|
0 |
|
0 |
||||||||||
Scope 1 and 2 greenhouse gas emissions intensity for aseptic carton production (metric tons CO2 equivalent/million m2 of sleeves produced) |
|
17 |
|
15 |
|
12 |
|
10 |
|
9 |
||||||||||
Scope 1 and 2 greenhouse gas emissions intensity for carton production (metric tons CO2 equivalent/million m2 of sleeves produced)3 |
|
– |
|
– |
|
– |
|
– |
|
8 |
||||||||||
Scope 1 and 2 greenhouse gas emissions intensity for production (bag-in-box and spouted pouch) (metric tons CO2 equivalent/thousand tons produced) |
|
|
|
|
|
|
|
0.14 |
|
0.16 |
||||||||||
Energy used for production from renewable sources (power purchase agreements or energy attribute certificates) or compensated using Gold Standard CO2 offset (%) |
|
1004 |
|
1004 |
|
1004 |
|
100 |
|
100 |
||||||||||
Electricity used for production from renewable sources (power purchase agreements or energy attribute certificates) |
|
1004 |
|
1004 |
|
1004 |
|
100 |
|
100 |
||||||||||
Operational energy use for production (GWh) |
|
3834 |
|
4024 |
|
3884 |
|
492 |
|
530 |
||||||||||
Energy intensity for aseptic carton production (MWh/million m2 of sleeves produced) |
|
201 |
|
197 |
|
183 |
|
175 |
|
183 |
||||||||||
Energy intensity for carton production (MWh/million m2 of sleeves produced)3 |
|
– |
|
– |
|
– |
|
– |
|
180 |
||||||||||
Energy intensity for production (bag-in-box and spouted pouch) (MWh/thousand tons produced) |
|
|
|
|
|
|
|
19 |
|
18 |
||||||||||
|
||||||||||||||||||||
Our positive impact
Through our Climate+ actions, we contribute to the United Nations Sustainable Development Goals.
See Forest+, Resource+, and Food+ for other ways in which we are driving positive impacts on climate change beyond our value chain.


Outlook
As we continue on our journey towards achieving net zero emissions by 2050, we recognize the urgent need to intensify our efforts and take decisive actions to bridge any potential gaps in our emission reduction goals. We have implemented a range of initiatives to significantly reduce our carbon footprint across our value chain, from material sourcing and production to product end-of-life.
Since 2020, we have actively pursued 14 projects that have reduced our greenhouse gas emissions. In 2024, as part of our Climate+ program, we conducted a detailed analysis of the estimated impacts of each of our projects. This comprehensive evaluation revealed that further actions are necessary to fully meet our emission reduction objectives.
In response, we have developed an optimistic scenario to accelerate our emission reduction efforts. We identified five new projects to complement our existing initiatives, ensuring that we are on track to achieve our absolute emission reduction target by 2030. Additionally, we are committed to proactively addressing any remaining gaps in 2025 to secure the successful attainment of our 2030 targets.
SIG’s decarbonization levers by 2030
- We established 2020 as our baseline year to accurately measure and compare greenhouse gas emission reductions over time in alignment with SBTi. All our projects are assessed against this baseline to track progress and effectiveness.
- In 2024, we have reviewed the size and relevance of our decarbonization levers, as covered in the following picture.
- A-materials: Optimization of supply chains and of utilization of SIG’s high-impact materials to significantly reduce Scope 3 Category. Includes projects focused on decreasing emissions from aluminum foil, liquid packaging board, polymers and ink production.
- Product portfolio: Optimization of the Terra portfolio by reducing the use of aluminum, thereby lowering Scope 3 Category 01 emissions associated with our products. By integrating eco-friendly materials and innovative design practices, we ensure that our products not only meet high-performance standards but also contribute to our broader low-carbon goals.
- Ecoinnovation: SIG’s commitment to introducing cutting-edge technologies and sustainable practices that significantly reduce greenhouse gas emissions from our packaging solutions, particularly in the spouted pouch and bag-in-box businesses.
- Filling lines: Optimization of our filling line operations to reduce energy consumption and associated emissions at our customers’ sites. By implementing energy-efficient technologies and improving utility management, we aim to decrease Scope 3 Category 11 emissions and also support our customers in meeting their own emission reduction goals.
- End-of-life: Enhancing our recycling efforts to mitigate emissions from product disposal. By increasing collection and recycling through circular practices, we aim to lower Scope 3 Category 12 emissions (see Resource+).
- Transportation: Implementation of sustainable logistics solutions to minimize emissions related to both inbound and outbound transportation.
- Other materials: Addressing emissions from miscellaneous purchased goods and materials to further reduce our Scope 3 Category 01 emissions. By implementing targeted emission reduction strategies for additional materials beyond our primary focus areas, we ensure a comprehensive approach to sustainability across all aspects of our supply chain.
- Business travel: Mitigation of emissions associated with employee travel for business purposes. By promoting sustainable travel practices, optimizing travel policies, promoting digital maintenance of our filling machines, and leveraging virtual meeting technologies, we aim to reduce Scope 3 emissions related to business travel.
- 2030 target: Since our corporate greenhouse gas performance is closely linked to the performance of our product portfolio along the product life cycle, we follow an intensity target which includes our entire value chain. Progress will be achieved by further improving the pack to product ratio together with effectively reducing absolute emissions. See Our commitments.

Carbon pricing: Our journey to decarbonizing our operations is already informed by a carbon price in the form of carbon offset pricing. We are exploring further whether a defined internal carbon price could support our current management approach by incentivizing decision-making that supports decarbonization, including in relation to major capital expenditures. As we continue to scale up our efforts, we are confident that the combination of strategic innovation, supplier engagement, customer collaboration and sustainable investment will enable us to close the gap and reach our 2030 interim goals. Achieving these milestones will set the foundation for our ultimate vision: to become Net Zero by 2050, with a clear focus on addressing both upstream and downstream emissions across our value chain.
SIG is fully committed to this sustainability journey and we will continue to refine our approach, invest in cutting-edge solutions, and foster partnerships that will help us meet the climate challenges ahead. Through transparent reporting, ambitious action and ongoing innovation, we aim to lead the way towards a sustainable future.
Managing climate-related risks and opportunities
We follow the recommendations of the Task Force on Climate-related Financial Disclosures (TCFD) to identify, manage and report climate-related risks and opportunities for our business – including potential financial impacts. See our TCFD report for more information.
1 The Intergovernmental Panel on Climate Change (IPCC) Report.
2 From November 2024. For the first 11 months of the year, responsibility was held by the Vice President of Global Sourcing & Procurement.
3 For the first 11 months of the year the Climate+ program was reviewed by the Vice President Global Production & CIS.
4 We currently purchase renewable electricity through energy attribute certificates, as well as directly through on- or off-site power purchase agreements.
5 Overall emissions consider Scope 1, 2 & 3 for SIG Group.
6 In 2024, we packed a total of 30.37 billion liters.
7 Based on independent, critically reviewed life-cycle assessments conducted in line with ISO 14040 and ISO 14044 standards.
8 Compared with standard SIG packaging material for aseptic cartons, based on EU27+3 average, cradle-to-grave results of independent, critically reviewed life-cycle assessments conducted in line with ISO 14040 and ISO 14044 standards.
9 Filling and packaging per pack.